
Grain/Livestock Overview 7/18/25
Grain/Livestock Overview 7/18/25
Overview
Grains
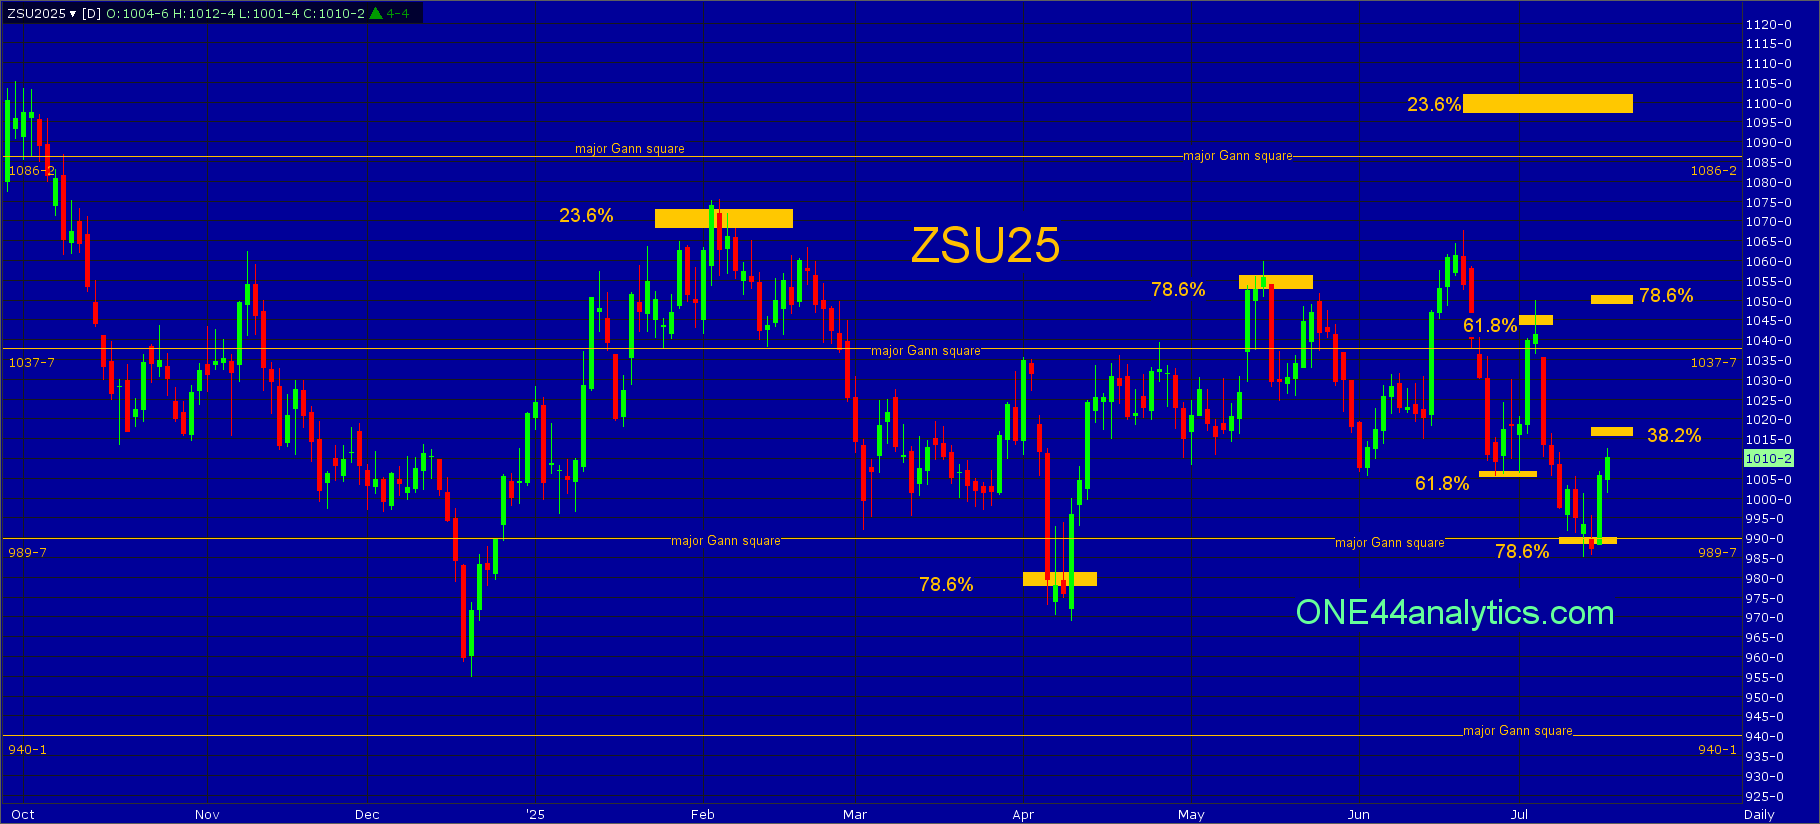
All of the Grains remain in a downtrend, however they have either hit or got very close to a 78.6% retracement in each market. We will now be looking for a rally of 78.6% the other way to start and as always we watch all the retracements on every move to see just how strong, or weak the market is, so any rally that can't get above 38.2% of the same move would keep the trends very negative.
In Soybeans, August traded below 78.6% at 1005.00 and is now back above it and in November it was 5 cents short of 993.00. The September contract held 78.6% at 989.75, this is also a major Gann square.
December Corn fell 7 ticks short of 78.6% at 405.75, this is also a major Gann square.
September Wheat has been sitting on 78.6% at 537.00 since the end of June.
Provided these levels hold it can also be the base of the next Bull move, per the ONE44 78.6% rule.
Livestock
Live/Feeder Cattle and Lean Hogs all remain in extremely strong trends.
Live Cattle and Feeders have held all the key retracements on every setback since the rally started on 9/9/24 and is working its way up to the next major Gann square once it has closed above the previous one.
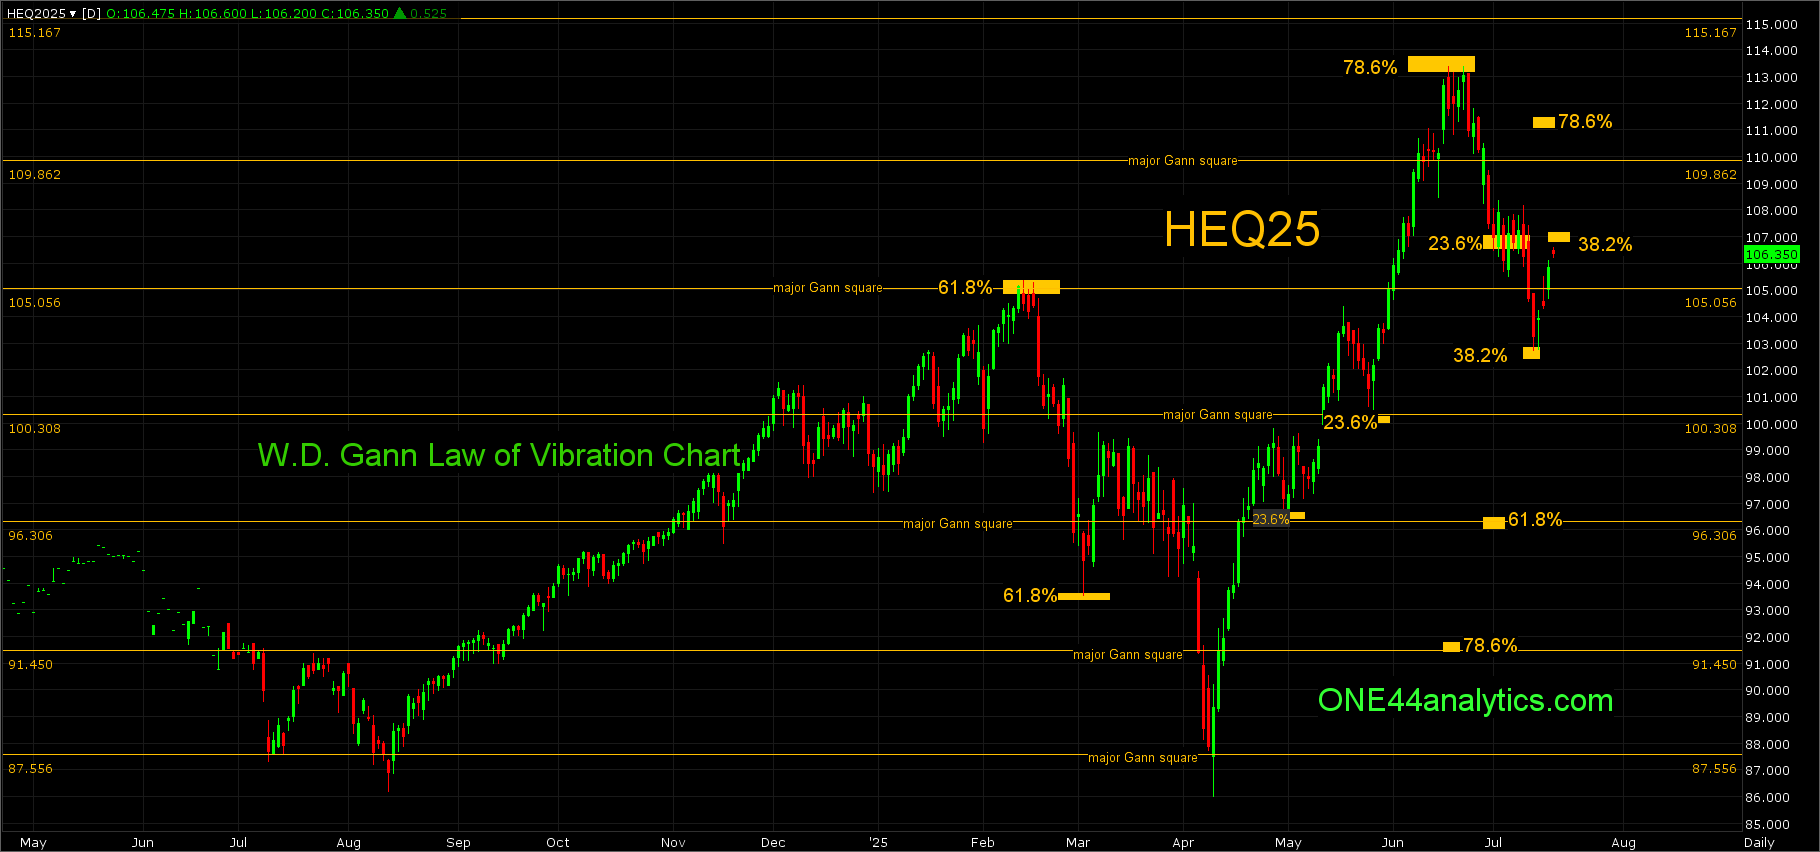
Lean Hogs was stopped by a 78.6% retracement from the continuation chart at 113.20 on 6/17/25 and the setback from it so far has held 38.2% keeping the up trend intact for now.
ONE44 Analytics where the analysis is concise and to the point
Our goal is to not only give you actionable information, but to help you understand why we think this is happening based on pure price analysis with Fibonacci retracements, that we believe are the underlying structure of all markets and Gann squares.
If you like this type of analysis and trade the Grain/Livestock futures you can become a Premium Member.
You can also follow us on YouTube for more examples of how to use the Fibonacci retracements with the ONE44 rules and guidelines.
Sign up for our Free newsletter here.
FULL RISK DISCLOSURE: Futures trading contains substantial risk and is not for every investor. An investor could potentially lose all or more than the initial investment. Commission Rule 4.41(b)(1)(I) hypothetical or simulated performance results have certain inherent limitations. Unlike an actual performance record, simulated results do not represent actual trading. Also, since the trades have not actually been executed, the results may have under- or over-compensated for the impact, if any, of certain market factors, such as lack of liquidity. Simulated trading programs in general are also subject to the fact that they are designed with the benefit of hindsight. No representation is being made that any account will or is likely to achieve profits or losses similar to those shown. Past performance is not necessarily indicative of future results.